Stock
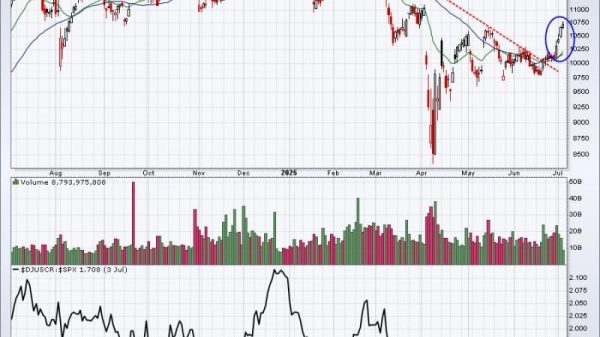
Here are some charts that reflect our areas of focus this week at XLU Leads with New High Even though the Utilities SPDR (XLU)...
Hi, what are you looking for?

CHARBONE presentera a la conference Hydrogen East et annonce le developpement d’un hub d’approvisionnement dans le marche de l’Atlantique via sa filiale

LaFleur Minerals Inc.Taking Key Steps to Advance Position in Prolific Gold Belt

Tartisan Nickel Corp. Intersects 24.6 Metres of 0.71% Ni, 0.56% Cu Including 6.1 Metres of 1.17% Ni, 1.45% Cu at the Kenbridge Nickel-Copper-Cobalt Project, Northwestern Ontario

Cartier Cuts 7.1 g/t Au over 8.0 m at Portal ; New Shallow High-Grade Gold Zone Discovered

NevGold Mobilizes Drill To Test Historical Leach Pads To Advance The Near-Term Antimony Production Scenario at Limo Butte
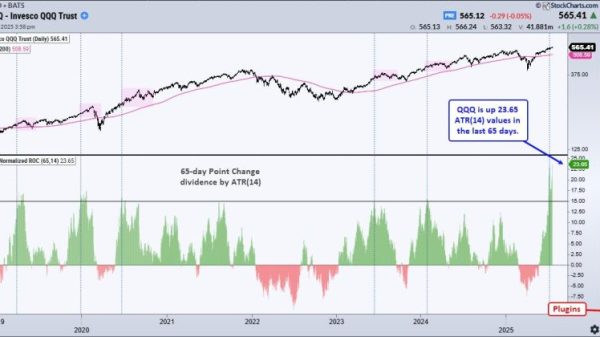
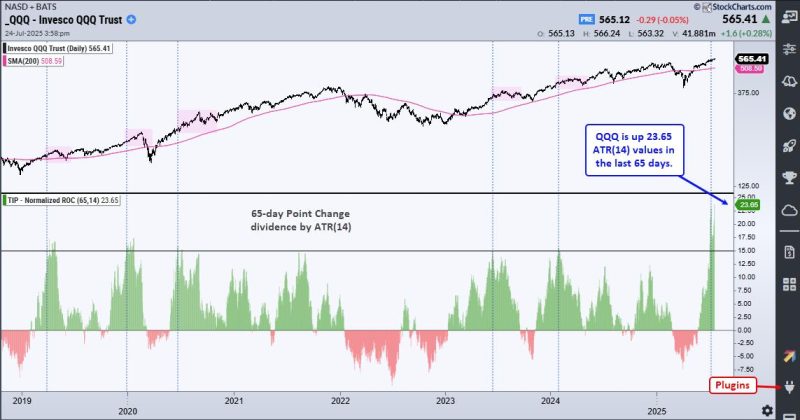
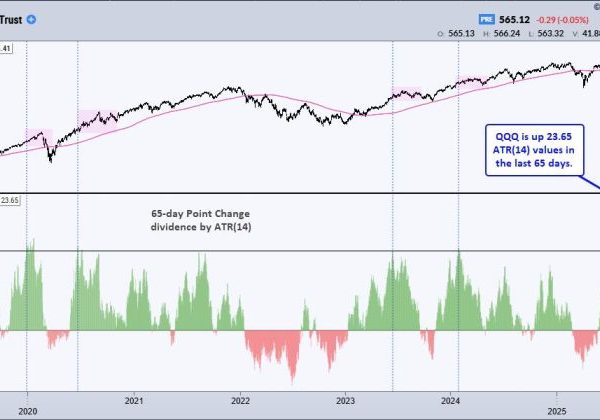
Chart Mania – 23 ATR Move in QQQ – Metals Lead 2025 – XLV Oversold – XLU Breakout – ITB Moment of Truth

S&P 500 Breaking Out Again: What This Means for Your Portfolio

Momentum Leaders Are Rotating — Here’s How to Find Them
Is META Breaking Out or Breaking Down?
A Wild Ride For the History Books: 2025 Mid-Year Recap

United Airlines says it will boot passengers who refuse to use headphones on planes

DOJ takes Live Nation-Ticketmaster to court for antitrust trial

L.A. County sues Roblox, alleges platform makes it easy for adults to target children

Warner Bros. Discovery reopens talks with Paramount

CFTC chief sides with prediction markets over state regulators in a high-stakes court case

Trump’s exaggerated claim that Pennsylvania has 500,000 fracking jobs

Tucker Carlson says father Trump will give ‘spanking’ at rowdy Georgia rally

A GOP operative accused a monastery of voter fraud. Nuns fought back.

American creating deepfakes targeting Harris works with Russian intel, documents show

Early voting in Wisconsin slowed by label printing problems
Here are some charts that reflect our areas of focus this week at XLU Leads with New High Even though the Utilities SPDR (XLU)...

The S&P 500 ($SPX) just logged its fifth straight trading box breakout, which means that, of the five trading ranges the index has experienced since...
Is the market’s next surge already underway? Find out with Tom Bowley’s breakdown of where the money is flowing now and how you can get...
The chart of Meta Platforms, Inc. (META) has completed a roundtrip from the February high around $740 to the April low at $480 and...


For those who focus on sector rotation, whether to adjust portfolio weightings or invest directly in sector indexes, you’re probably wondering: Amid the current...

A good trade starts with a well-timed entry and a confident exit. But that’s easier said than done. In this video, Joe Rabil of...

After months of whiplash sector swings, the market may finally be showing signs of settling down. In this video, Julius de Kempenaer uses Relative...

When sector performance shifts gears from one day to the next, it’s best to be prepared with a handful of stocks from the each...


Just when we thought tariff talk had gone quiet, it’s back on center stage. With the reciprocal tariff deadline landing this Wednesday, President Trump...
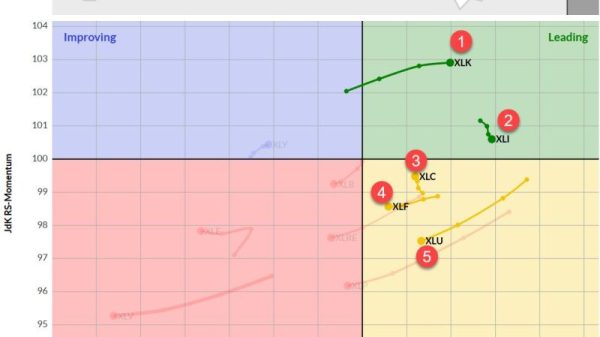
The past week has been relatively stable in terms of sector rankings, with no new entrants or exits from the top five. However, we’re...
I like to trade stocks that are relative leaders and belong to industry groups that are leaders as well. For the past 2-3 months,...
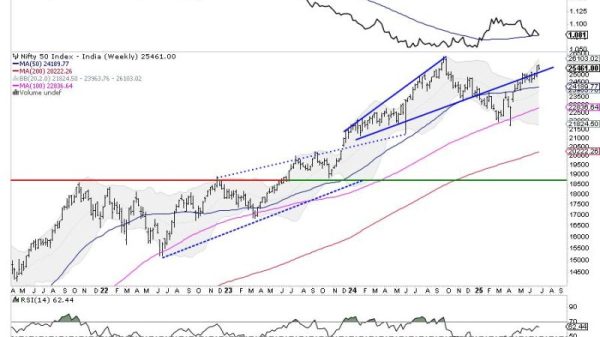
After a strong move in the week before this one, the Nifty spent the last five sessions largely consolidating in a very defined range....

Feeling a little anxious about the market, even with a strong economy? The truth is, money isn’t fleeing the market; it’s simply moving around,...

This holiday-shortened week was anything but short on action! The S&P 500 and Nasdaq Composite closed at record highs, but what is really driving...