Stock
Here are some charts that reflect our areas of focus this week at XLU Leads with New High Even though the Utilities SPDR (XLU)...
Hi, what are you looking for?

CHARBONE presentera a la conference Hydrogen East et annonce le developpement d’un hub d’approvisionnement dans le marche de l’Atlantique via sa filiale

Cartier Cuts 7.1 g/t Au over 8.0 m at Portal ; New Shallow High-Grade Gold Zone Discovered

NevGold Mobilizes Drill To Test Historical Leach Pads To Advance The Near-Term Antimony Production Scenario at Limo Butte

LaFleur Minerals Inc.Taking Key Steps to Advance Position in Prolific Gold Belt

Tartisan Nickel Corp. Intersects 24.6 Metres of 0.71% Ni, 0.56% Cu Including 6.1 Metres of 1.17% Ni, 1.45% Cu at the Kenbridge Nickel-Copper-Cobalt Project, Northwestern Ontario
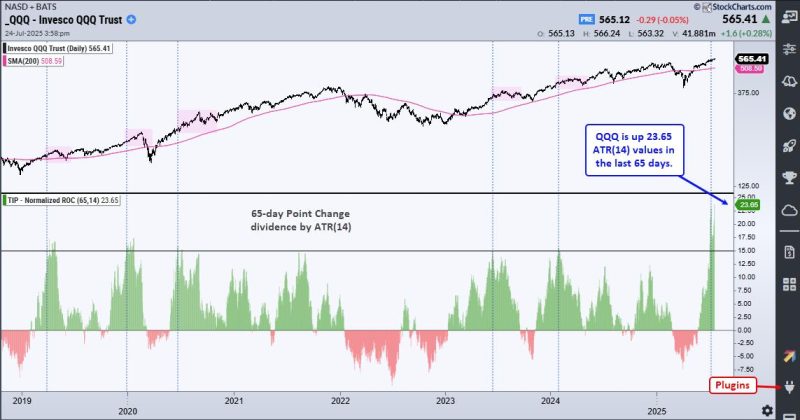
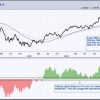
Chart Mania – 23 ATR Move in QQQ – Metals Lead 2025 – XLV Oversold – XLU Breakout – ITB Moment of Truth

S&P 500 Breaking Out Again: What This Means for Your Portfolio

Momentum Leaders Are Rotating — Here’s How to Find Them
Is META Breaking Out or Breaking Down?
A Wild Ride For the History Books: 2025 Mid-Year Recap

United Airlines says it will boot passengers who refuse to use headphones on planes

DOJ takes Live Nation-Ticketmaster to court for antitrust trial

L.A. County sues Roblox, alleges platform makes it easy for adults to target children

Warner Bros. Discovery reopens talks with Paramount

CFTC chief sides with prediction markets over state regulators in a high-stakes court case

Trump’s exaggerated claim that Pennsylvania has 500,000 fracking jobs

Tucker Carlson says father Trump will give ‘spanking’ at rowdy Georgia rally

A GOP operative accused a monastery of voter fraud. Nuns fought back.

American creating deepfakes targeting Harris works with Russian intel, documents show

Early voting in Wisconsin slowed by label printing problems
Here are some charts that reflect our areas of focus this week at XLU Leads with New High Even though the Utilities SPDR (XLU)...

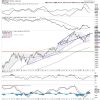
The S&P 500 ($SPX) just logged its fifth straight trading box breakout, which means that, of the five trading ranges the index has experienced since...
Is the market’s next surge already underway? Find out with Tom Bowley’s breakdown of where the money is flowing now and how you can get...
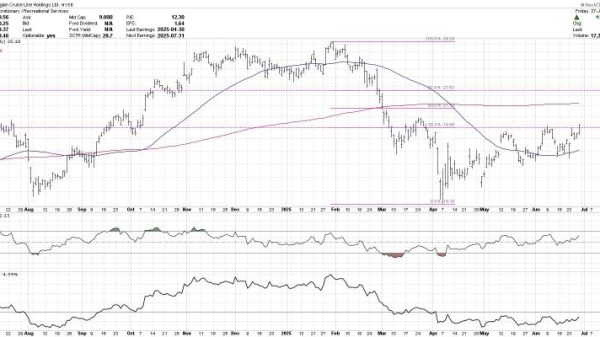
The chart of Meta Platforms, Inc. (META) has completed a roundtrip from the February high around $740 to the April low at $480 and...
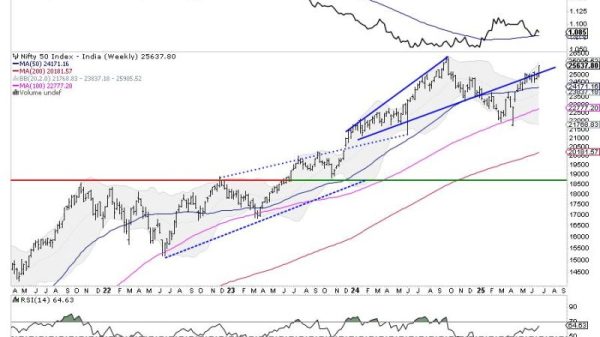
After six weeks of consolidation and trading in a defined range, the markets finally broke out from this formation and ended the week with...


As we head into the second half of 2025, here are three stocks that present strong technical setups with favorable risk/reward profiles. One is...
If you’ve looked at enough charts over time, you start to recognize classic patterns that often appear. From head-and-shoulders tops to cup-and-handle patterns, they...
The bears are now left grasping at straws. What about tariffs? What about inflation? What about recession? What about the Fed? What about interest...
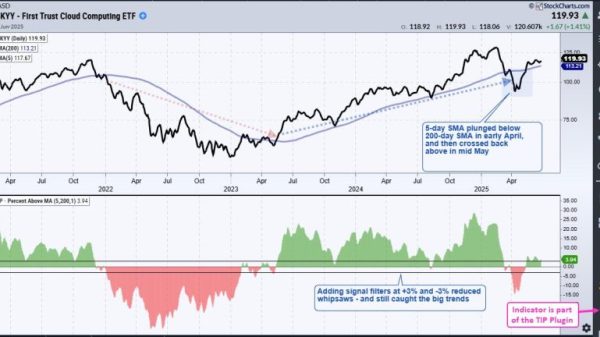
Chartists can improve their odds and increase the number of opportunities by trading short-term bullish setups within bigger uptrends. The first order of business...
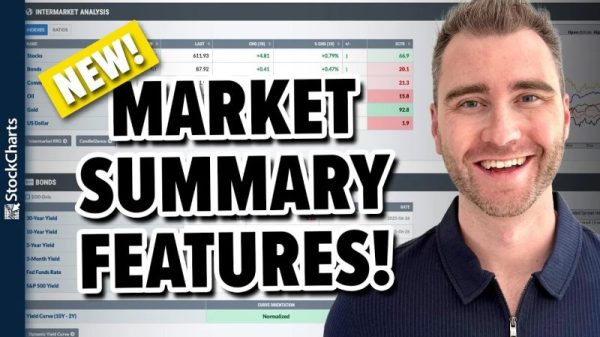

Take a tour of the FIVE latest updates and additions to our fan-favorite, professionally-curated Market Summary dashboard with Grayson! In this video, Grayson walks...


Over a month ago, Super Micro Computer, Inc. (SMCI) appeared on our StockCharts Technical Rank (SCTR) Top 10 list. SCTRs are an exclusive StockCharts...

MACD, ADX and S&P 500 action frame Joe Rabil’s latest show, where a drifting index push him toward single-stock breakouts. Joe spotlights the daily...


The S&P 500 ($SPX) just logged its second consecutive 1% gain on Tuesday. That’s three solid 1% advances so far in June. And with...
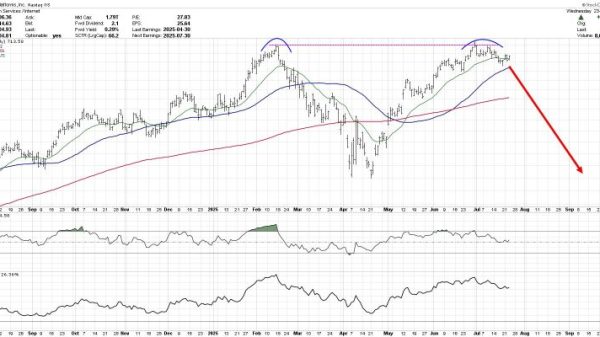
Think trading against the trend is risky? You may want to reconsider. When a stock or ETF is trending lower, the smart money watches...